What do Eggs and Probability Have in Common?

Rusty Bresser
I love it when I break an egg and a double yolk appears. It’s like nature’s magic at work. That’s what happened the other day when I was making breakfast. After that little surprise, I proceeded to break another egg and voila! Another double yolk! Since I was making breakfast for two, I cracked yet another egg and was mystified when a third double yolk appeared. Three in a row—what’s the probability of that happening?!
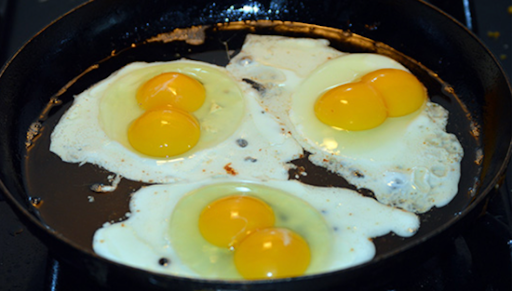
After breakfast, I emailed a friend to share my triple double yolk discovery and she promptly sent me a link to an article that explains the probability of the “six yolks for three eggs” mystery. It seems that there’s about a one in a billion chance of getting three double yolk eggs in a row! Go figure.
The egg yolk story is just one example of how we see probability and statistics play out in the world around us. Probability allows us to assess the certainty of outcomes when we ask questions like, “Who will win the election?” “How likely is it to catch Covid if I wear a mask?” “Which sum will I most likely roll when rolling two dice?”
Probability activities can pique students’ interest and bring joy to learning and doing mathematics. The following probability lessons are some of our favorites and are appropriate for students of almost any age. We hope you try them out!
Is it 10?
I learned about this activity from Bonnie Tank in her book, Probability Grades 1-2 (Math Solutions, 1996). In the lesson, students investigate whether the sum of the numbers on two playing cards chosen at random is likely to be less than 10, exactly 10, or greater than 10. Before you jump into exploring this yourself, what’s your prediction? Make a guess and then find out. Here’s what you do:
- Use a deck of playing cards, Ace (which stands for one) through 10 (remove the face cards). Shuffle. You can play alone or with a partner.
- To play, turn over two cards, figure the sum of the two numbers, and record it as less than 10, exactly 10, or greater than 10. Play many times and see what happens, keeping track of the data as you play.
- In the classroom, students can post their data on a class chart and then engage in a Data Talk (a short 5-10 minute classroom discussion to help students develop data literacy) as you ask them questions about the experimental data such as:
What do you notice?
What do you wonder?
What is more likely to happen? Why?
What is less likely to happen? Why?
Is It 10? is a rich task that engages students in figuring sums, making predictions, and collecting and analyzing data. For older students, you can extend the activity to include the theoretical probability of what “should happen” with the data during the lesson. Engage students in a data talk, eliciting from them all the combinations for the sums 2-20, then ask them what they notice.
Below is an organized list of all the possible combinations for the sums when adding two cards together. You’ll notice that there are 100 total possibilities, 36/100 are sums less than 10, 9/100 are sums exactly 10, and 55/100 are sums greater than 10.
2 1+1
3 1+2, 2+1
4 1+3, 3+1, 2+2
5 1+4, 4+1, 3+2, 2+3
6 1+5, 5+1, 4+2, 2+4, 3+3
7 1+6, 6+1, 5+2, 2+5, 3+4, 4+3
8 1+7, 7+1, 2+5, 5+2, 4+3, 3+4, 4+4
9 1+8, 8+1, 7+2, 2+7, 3+6, 6+3, 5+4, 4+5
10 1+9, 9+1, 8+2, 2+8, 3+7, 7+3, 6+4, 4+6, 5+5
11 1+10, 10+1, 9+2, 2+9, 3+8, 8+3, 7+4, 4+7, 5+6, 6+5
12 2+10, 10+2, 9+3, 3+9, 4+8, 8+4, 5+7, 7+5, 6+6
13 3+10, 10+3, 4+9, 9+4, 5+8, 8+5, 6+7, 7+6
14 4+10, 10+4, 5+9, 9+5, 6+8, 8+6, 7+7
15 5+10, 10+5, 6+9, 9+6, 7+8, 8+7
16 6+10, 10+6, 7+9, 9+7, 8+8
17 7+10, 10+7, 8+9, 9+8
18 8+10, 10+8, 9+9
19 9+10, 10+9
20 10+10
Alphabet Probability
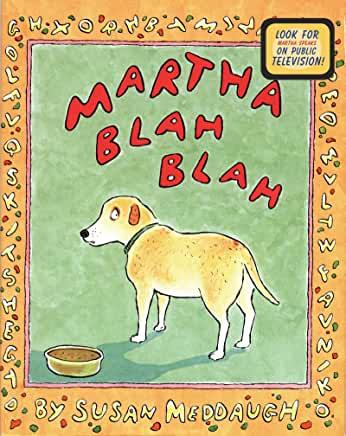
Have you ever thought about whether any letters of the alphabet are used more or less than other letters (in English)? What do you think? Take a guess! That’s how this lesson begins. Students have lots of ideas. Some reason that vowels are used more since there are only five of them. Others think ‘S’ happens more often because it makes things plural. Still others argue that X, Y, and Z aren’t used very much, “Because, well, we just don’t see them in books very often.”
I love this lesson because students are intrigued from the very start. Once their predictions are shared, I read them the book, Martha Blah Blah by Susan Meddaugh (1998). For those of you who aren’t familiar, Martha is a dog who is able to talk as the result of eating a bowl of alphabet soup every day. But one day, when Granny Flo inherits the soup company, she immediately fires thirteen of the twenty-six pasta letter makers for the sake of bigger profits.
The elimination of these letters from the soup makes Martha’s speech amusing but completely unintelligible. Which brings us to the key question: Which letters would you choose to keep in the alphabet soup so that Martha’s speech could be at least intelligible? In other words, which letters are used more than others? Which letters could Granny Flo eliminate and why?
Directions:
- Choose a sentence from a book (10 to 20 words long).
- Tally how many times each letter appears in the sentence you chose.
- Record your results on a class chart.
I love this activity for many reasons. Students get to make predictions which gives them a stake in the results. There’s a literature and real-world connection that gives meaning and purpose to mathematics. Students learn about and use the language of probability and statistics, words like “sample,” “data,” and “frequency.” And finally, students can engage in writing an argument for which letters Granny Flo could eliminate and still allow Martha to make sense when talking!
The neat thing about real world math is that students can compare their results with data collected from mathematicians. Did you know that the most frequently used letter in the English language is E? It’s used about 11% of the time. J, Q, and Z are the least frequently used letters. If you don’t believe me, collect data, and see for yourself! Even Samuel Morse had to answer this question when he invented the Morse Code.
Tiles in the Bag
This lesson introduces students to sampling with replacement to predict how many of each color are in a bag of Color Tiles. Students love making predictions, collecting, and analyzing data, and finding out if their guesses are correct or not. Here’s how it works.
- Hold up a lunch bag with 8 yellow tiles and 4 red tiles in it. Don’t tell the students the exact contents, but tell them there’s 12 tiles inside, some are red and some yellow.
- Ask students what could be inside the bag: how many red, how many yellow tiles? Write their ideas on the board, making a list of the combinations (1 red, 11 yellow; 2 red, 10 yellow, and so forth until you have all eleven possibilities).
- Have one student at a time reach into the bag, take out one tile without looking, record what color was removed, and then put the tile back inside the bag; this is called “sampling with replacement.”
- Continue until you’ve sampled 12 times.
- Have the students look at the data and make a prediction about which combination of red and yellow tiles they think are in the bag.
- Continue with 12 more samples.
- Have the students create an argument for which combination of red and yellow tiles they think are hidden inside the bag.
- Reveal!
Students enjoy this activity! They get to make predictions, and their predictions are based on the data they’ve collected, not some random wild guess. And they learn that the bigger the sample size, the better their predictions will be, an important law of probability.
Tiles in the Bag is a nice way to begin math class, no matter what topic you are teaching. And it’s a good way to keep data science alive throughout the year. All you have to do is keep changing up the colors and numbers of tiles in the bag.
Probability: An Exciting Way to Connect Math to the World Around Us
Probability is an important part of data science. It can help us predict the certainty of events and it teaches us that some events are more likely to happen than others, and some are equally likely to happen. It also teaches us that a larger sample size of data gives us more reliable information. Most importantly, engaging in probability activities helps students connect mathematics to the world around us. So, the next time you break an egg for breakfast, make a prediction, and hope for a double!
