Venn Diagrams in Math Class… A Big Hit!

Rusty Bresser
What’s a Venn Diagram?
Way back in the 1880’s, John Venn popularized this graphic organizer to illustrate the relationships between two or more sets of items. In fact, Venn-style diagrams have been around since the Middle Ages. Today, Venn diagrams are used in a variety of ways. For example, businesses use them to represent market behavior and derive conclusions about their customers’ needs and demands in pictorial forms. In math class, we can use Venn diagrams to learn about one another and build a sense of community in the classroom. Students can also use them to collect, analyze, and interpret data, and to learn about numbers, operations, and their relationships.
Making Sense of Data and Building Community
I recently visited my friend and colleague Danielle Zdunich’s fourth grade class and shared a lesson with her students using Venn diagrams. The kids loved it, and it was a great way to begin the school year!
As students filed in from recess and assembled on the front rug, I posted the following Venn diagram on the whiteboard and asked them, “What do you notice about my Venn diagram?” Rather than start by explaining what a Venn diagram is, I began with this open question to get students engaged right away.

Hands shot up. Students noticed that I love to travel, that I can surf and speak Spanish. They noticed that I put an ‘x’ in the intersection of the three circles and explained why.
I asked Danielle where she would put an ‘x’ on my diagram. She thought for a second, then pointed to where her ‘x’ would go and explained that she also loves to travel, but doesn’t surf or speak Spanish, so her ‘x’ would go only in the purple circle where it doesn’t overlap with the others. I then asked the students to share with a partner where they would put their ‘x’ on my Venn diagram.
I finished launching the lesson by having students think, then share with a partner three things they might include on their own Venn diagram. Soon, students were returning to their seats to create their own diagrams, each with a piece of newsprint, a pencil, and access to markers.
Gallery Walk
Once students were finished making their Venn diagrams, they were ready to circulate the room and read one another’s diagrams and place their ‘x’ where they belonged.
The room buzzed with excitement as students roamed around, chatting and signing. Some were perplexed as to where to put their ‘x’ and had to reach out for help from their friends. I heard lots of comments as they responded and connected to one another’s diagrams. “Hey! She likes strawberries too!” and “Lots of people love dogs!” Students also asked questions like, “What are pastels?” “I wonder who likes ballet?” It was impressive to witness 100% engagement and to see the joy on students’ faces as they learned about the similarities and differences among their classmates.
As I made my way around the classroom, I felt like an anthropologist sneaking a peek into a different culture. These fourth graders had lots of things they loved and liked. Pools, soccer, pastel colors, yoga, hockey, nachos, and hamburgers, just to name a few. Some favorites included dogs, Boba tea, Bluey (an animated character), chocolate, strawberries, video games, and ducks! I was happy to see that many students loved books and reading.
During the gallery walk, I learned new things about fourth graders. For example, when reading one boy’s Venn, I wondered aloud about Fortnite. “What’s that?” I asked. He rolled his eyes in response to what
seemed to him like a naive question and informed me that it’s a popular video game.
Summarizing the Data
When students seemed finished signing, I called them back to the rug to share different ways to summarize their data. I posted Leia’s Venn diagram on the whiteboard to use as a model. I also posted the following sentence starters and frames for students to use when summarizing.
- A few of us…
- Some of us…
- About ____ of us…
- Most of us…
- Only ___ of us…
- Almost all of us…
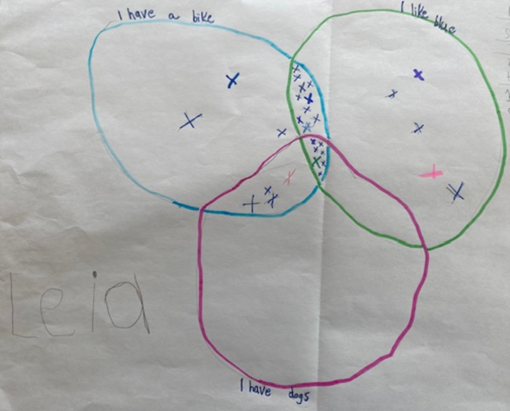
Students had lots of ideas for describing Leia’s data.
“Most of us have a bike.”
“Almost all of us like blue.”
“Eleven of us have dogs.”
After writing down their ideas, I took the opportunity to model using fractions to represent parts of a set. For example, I rewrote “Eleven of us have dogs” to read, “11/29 of us have dogs.” We talked about why this made sense and what the numbers in the fraction mean, and I encouraged the class to use fractions when describing their data.
Writing and Sharing About Data
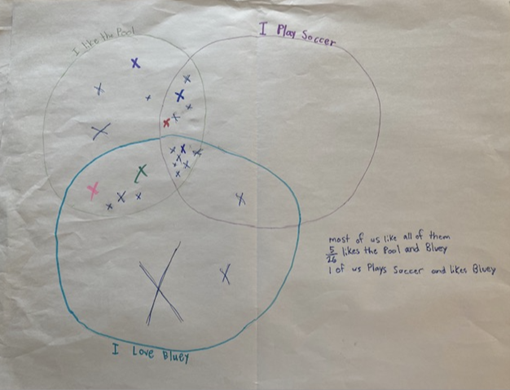
As Danielle and I circulated the room and observed students writing their summary statements, we noticed that most were able to make sense of and write about their data. And about half of the class used fractions in their written descriptions. For example, this student (see below) wrote, “5/26 likes the pool and Bluey.”
One student demonstrated her “fraction sense” by writing, “15/32 of us like art, blue, and reading (that’s close to half). Knowing that 15/32 is close to one half is impressive and could be used in a follow-up data talk. In such a talk, a teacher might pose the statement, “15/32 is close to one half. Do you agree or disagree? Why?” (learn more about Data Talks here).
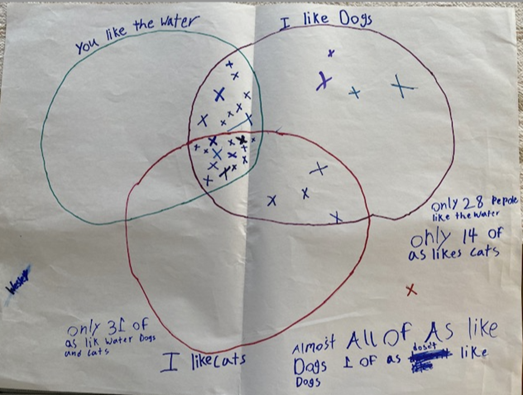
A few students struggled when counting data. The student below for example claimed that “Only 14 of us like cats.” But when you count the data inside the red circle, it adds up to more than 14 because he didn’t count the ‘x’s where the red and purple circles overlap. This ‘mistake’ could also be used in a subsequent data talk to clarify how and where to count when calculating data on a Venn diagram.
Posing a Challenge
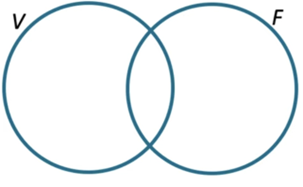
If you want to pose a challenge for students as a follow up to the Venn diagram lesson, present the following information to students:
- 40 people were asked if they play volleyball or football.
- 15 said they play volleyball.
- 5 said they play both.
- 5 said they play neither.
Then, ask them to illustrate the information on the following Venn diagram using x’s:
Using Venn Diagrams with Younger Children
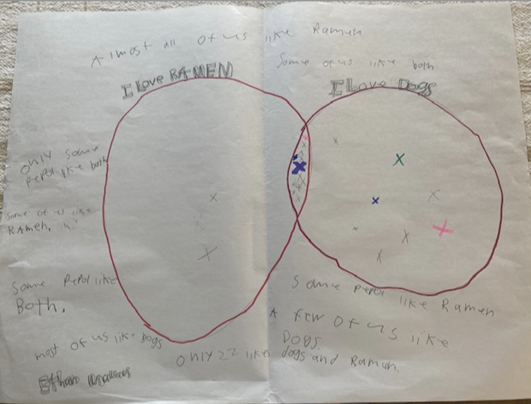
With students in the early grades, or when differentiating instruction with older students, we recommend using double Venn diagrams (2 circles rather than 3) to compare two sets of data. Here’s Ethan’s Venn diagram from Danielle’s class. He chose to create a double Venn, collecting data about Ramen and dogs.
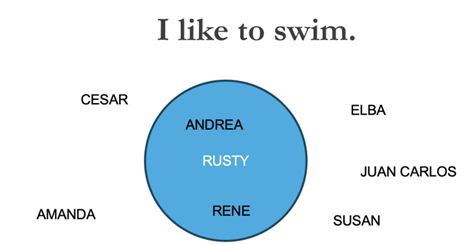
For even younger children, we recommend using only one circle. Although it’s not technically a Venn diagram since it’s not comparing data sets, it’s a nice way to introduce the idea. With one circle, you’re either in or you’re out…do you like apples or not?
Venn Diagram Guessing Games
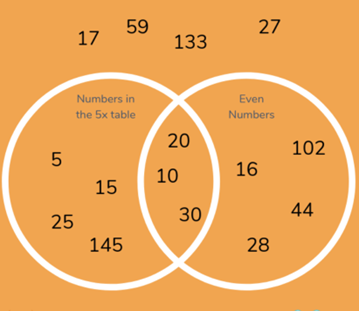
For students learning about multiplication and characteristics of numbers (or any math content), try playing guessing games. For example, follow these directions:
- Create an empty double Venn diagram (don’t write the labels for each circle yet, keep it a secret). Elicit whole numbers from the class.
- Each time a student guesses a number, write it in the correct place on the Venn diagram. Place the number outside or in the ‘universe’ if it doesn’t belong in either circle or in the intersection of the circles).
- Keep eliciting numbers and writing them where they belong. After a while have students guess the ‘rule’ for each circle. Below is an example of a completed guessing game.
Venn Diagrams, Data Science, and More!
As we mentioned in an earlier post about data science, making sense of data in our complex world is becoming an essential part of life and being able to analyze and understand what data is telling us is crucial to being an informed citizen. Venn diagrams not only can give students an opportunity to make sense of data and learn about numbers and operations, but they also can be used to build a sense of community in the classroom. Try them out!
Also… a special thanks to Danielle Zdunich and her fourth graders!
